
Installed prices, system size and the cash-loan gap
- Lawrence Berkeley National Laboratory, U.S. Distributed Solar and Storage 2025 Data Update (Tracking the Sun), October 2025, covering installs through year-end 2024
What home solar costs per watt, what happened to the federal credit, and why exported power is worth different amounts by state. Every figure sourced and dated.
What does this site do?
Solar Panel Answers connects you with licensed local solar companies.
We earn a referral fee from the company you are matched with. You pay us nothing for the match, and we do not set the price you are quoted.
Because one measures what people paid and the other models what a system should cost to build. Lawrence Berkeley National Laboratory puts the 2024 median residential price at $4.0 per watt before any incentive; NREL's bottom-up benchmark for the first quarter of 2024 is $3.25 per watt. Neither is wrong.
NREL gives the reason itself: reported pricing is “more likely to include cost categories not within the cost benchmarks' scope, such as financing costs, roof upgrades, or service contracts”, and is based on national averages rather than representative configurations (NREL/TP-7A40-92536, January 2025). The LBNL figures are gross prices for host-owned systems, before any incentive or tax credit, in 2024 dollars per watt-DC.
The spread inside the LBNL data matters more than the gap between the two sources. The middle 60% of 2024 installs ran $3.0 to $5.2 per watt, and the split by payment method is wider still: a median of $3.5/W for cash purchases against $4.7/W for loan-financed systems. LBNL attributes that gap to dealer fees rolled into the up-front price the customer sees, and it has widened from $0.6/W in 2017 to $1.2/W in 2024.
Two more figures worth carrying into a sales conversation. Prices were essentially flat between 2023 and 2024, within ±$0.1/W in inflation-adjusted terms, and NREL describes its benchmark costs since 2021 as relatively flat, with ups and downs caused by market dynamics such as policy changes, tariffs and supply chain constraints. And roughly 80% of what you pay at the 2024 median is soft costs and balance-of-system rather than the panels themselves — which is why two quotes listing identical hardware need not be anywhere near each other.

Three layers, and only the first is the same everywhere: hardware and its warranties are national products, the value of exported power is set by state policy and utility tariff, and the production estimate belongs to your roof alone. A quote that blurs the three cannot be compared against another quote - the same rooftop system can be worth materially different amounts in two neighbouring states, or under two utilities in the same state, because the export credit is set by policy and tariff rather than by the panels.
Federal statute and national-laboratory documents, not local practice.
Policymakers, regulators and utilities decide these collectively (NREL, updated 2026-02-20).
Only the last of these comes off a document you already own: your utility bill.
Because completion is the statutory test, not payment. IRC §25D(e)(8)(A) treats an expenditure as made “when the original installation of the item is completed”. P.L. 119-21, enacted 4 July 2025, ended the Residential Clean Energy Credit for expenditures made after 31 December 2025 — so a 2025 deposit with a 2026 finish gets nothing.
The credit was 30% of the cost of purchasing, assembling and installing qualifying equipment, and it applied from 2022 through 31 December 2025. The IRS states it plainly: “The credit is not available for any property placed in service after December 31, 2025.” The 2025 Instructions for Form 5695 put the same rule in the taxpayer's own words.
What the repeal did not touch is the carryforward. A qualifying expenditure made before the end of 2025 can still carry unused credit forward, and carryforwards may be used indefinitely until the entire amount is taken. The credit is nonrefundable, so it never pays out beyond your tax liability. CRS works its own example: a $30,000 system earns a $9,000 credit, and a taxpayer owing $7,000 goes to zero and carries $2,000 forward.
That carryforward mattered to most claimants rather than a few. Of roughly 1.4 million taxpayers who qualified in tax year 2023, 46.5% used the entire credit that year, 43.3% carried part of it forward and 10.2% carried all of it forward.
The median US residential system installed in 2024 was 7.2 kW, with the middle 60% of installs between about 4 and 11 kW. The mean, 9.3 kW, is pulled up by large systems. The average US residential customer bought 865 kWh a month in 2024 at 16.5 cents per kilowatt-hour.
Keep the distinction straight, because sales material rarely does. 7.2 kW is an observation of what households installed; 7.9 kW-DC is a configuration NREL models for its cost benchmark; neither is a recommendation for your roof. California's median was 5.7 kW while most other states sat above 7 kW, which is a reminder that the typical system is a local quantity too.
EIA raises its own caveat on the consumption figure, and it is the one a solar reader needs: these are electricity purchases, not consumption. Net-metered PV reduces purchases, so in states with a lot of rooftop solar, what households actually use is higher than the number shows.
Every figure on this page traces to one of these. Ranges are reported as ranges.
The kilowatt-hours you used over the last year is the number every honest quote is built from. Without it, any price is a guess.
Pitch, orientation and shade decide how much of that usage a system can realistically cover. This is the step door-to-door pitches skip.
Cash, loan and lease are three different products. Compare system size and total price first, then compare the financing separately.
The work is done by licensed local solar companies. We do not sell panels and we do not fit them.

The main case: you own the roof, you pay the utility bill, and the decision turns on how long you plan to stay in the house.
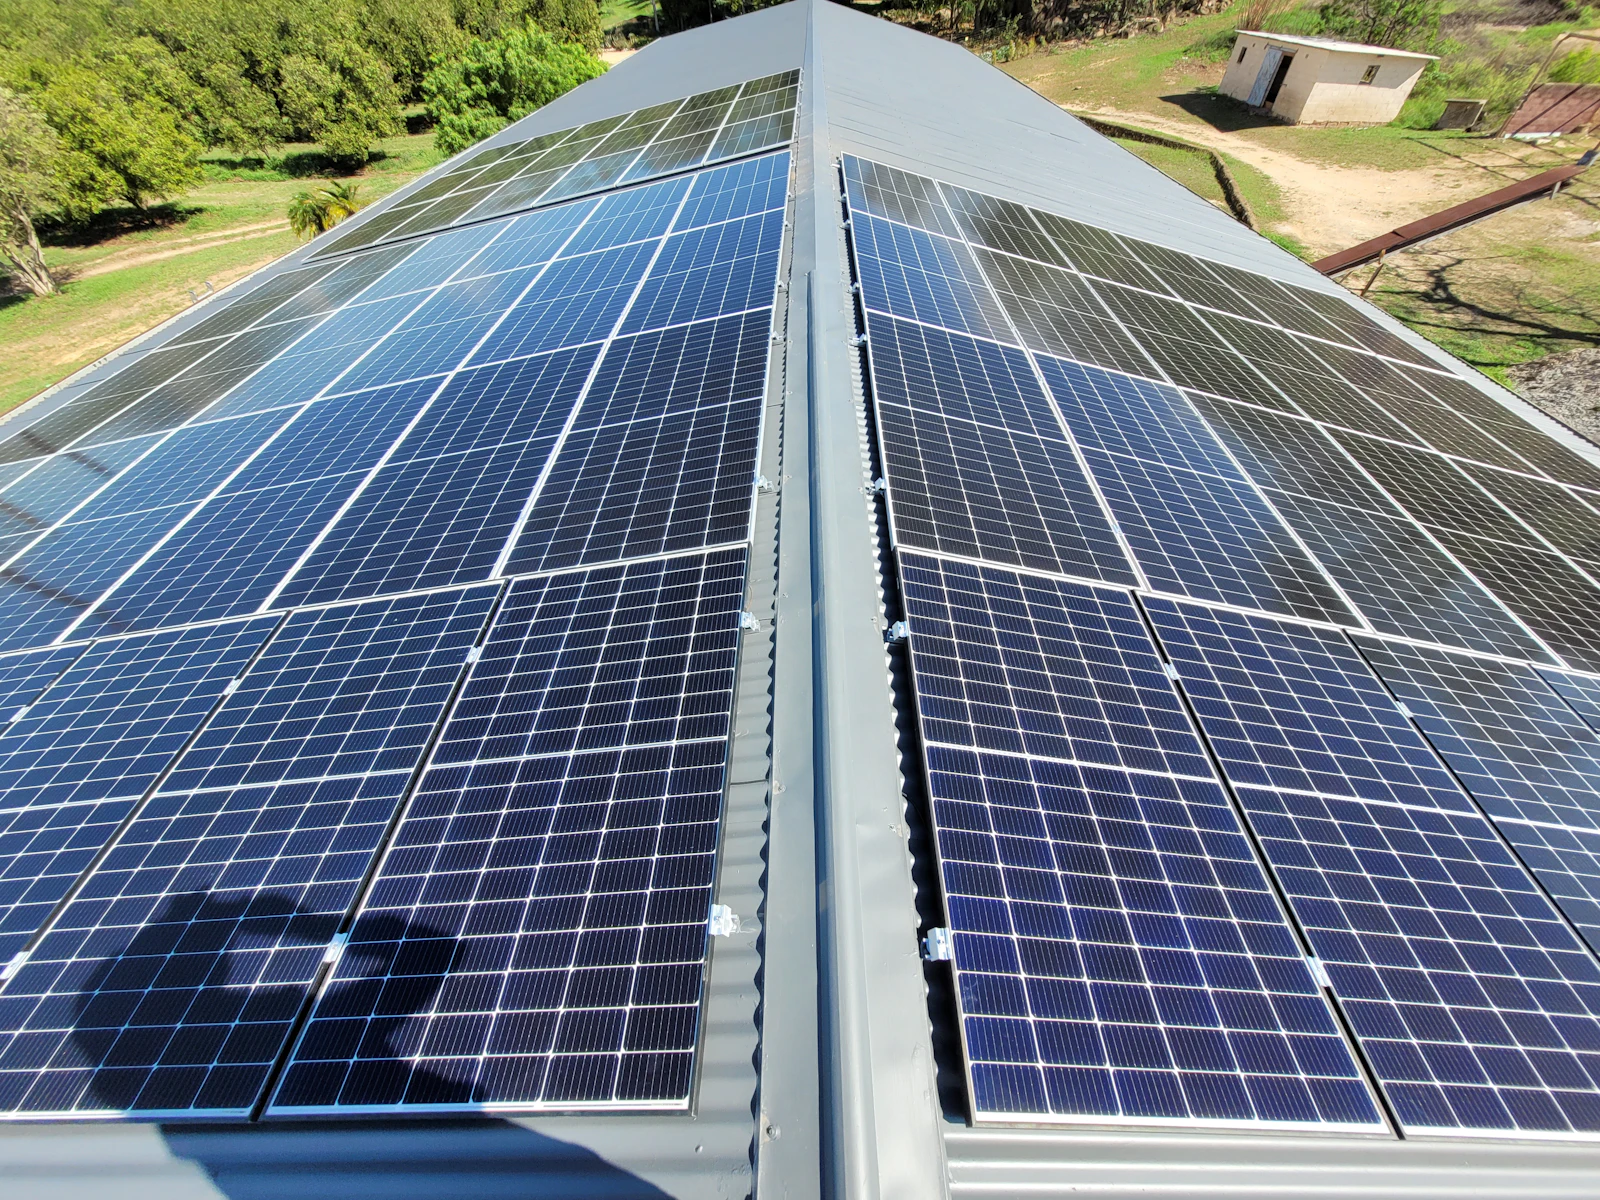
A commercial roof changes the arithmetic rather than the hardware - different tariff, different tax position, different depreciation.
A residential quote arrives as a single number covering all of this. Knowing which part is which is how two quotes that look nothing alike become comparable.
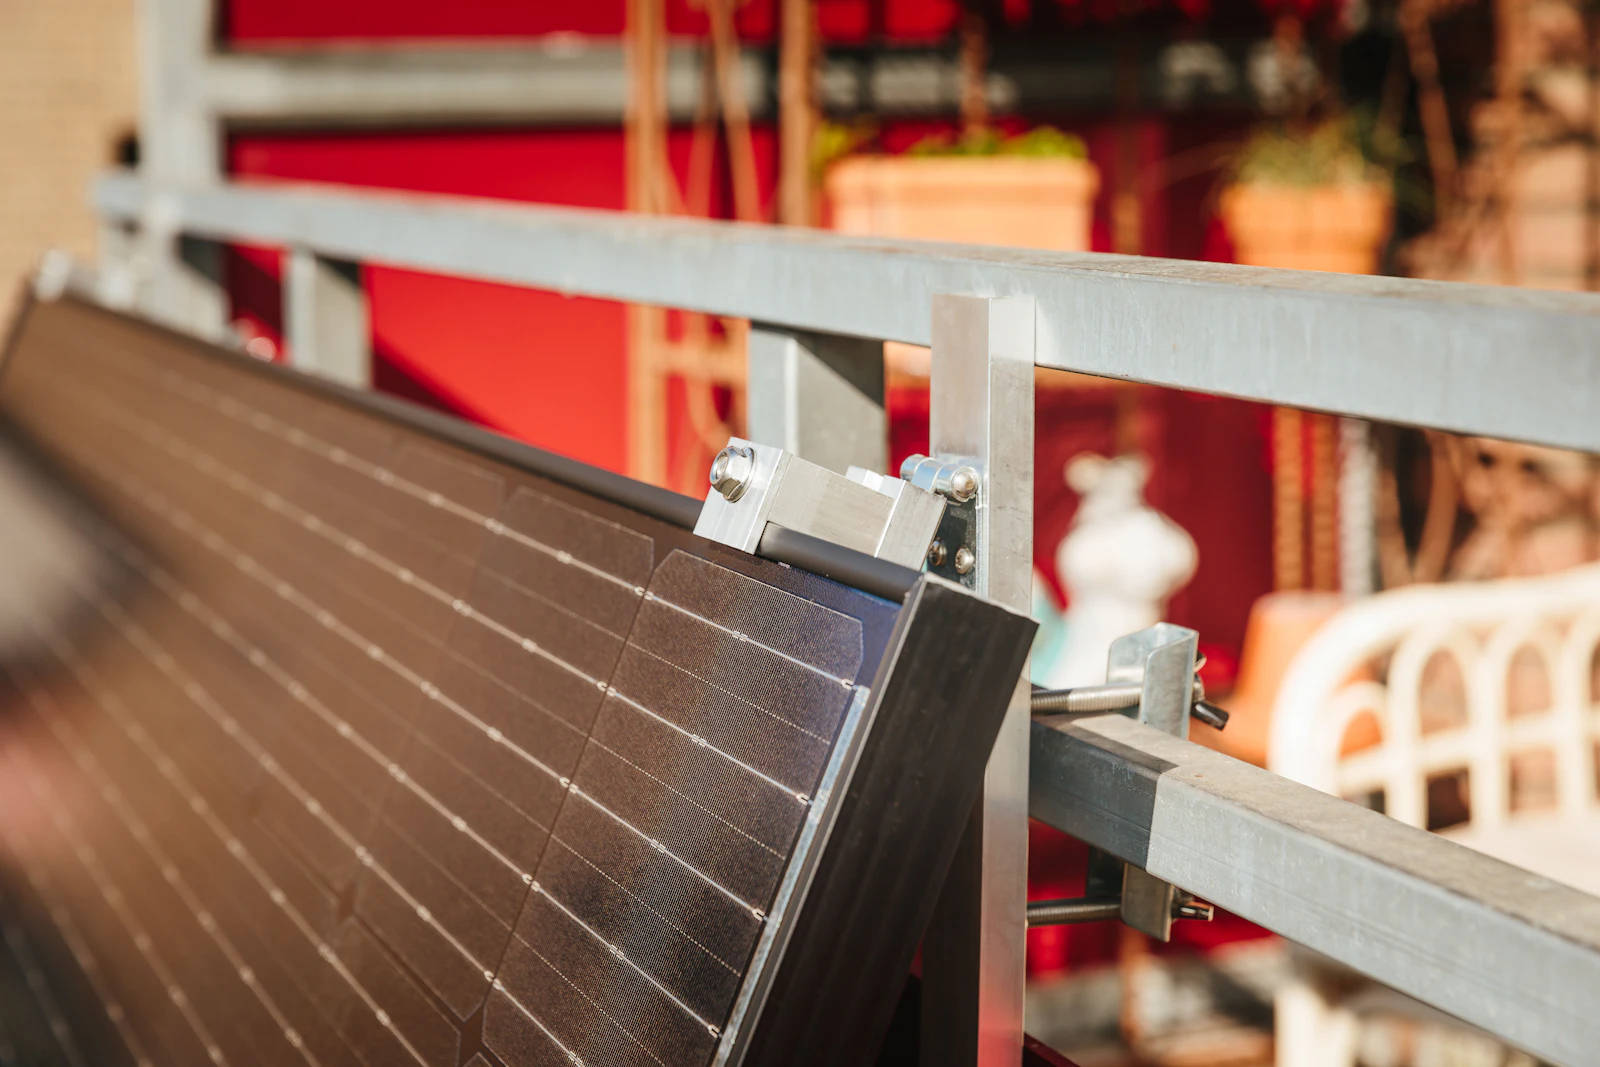
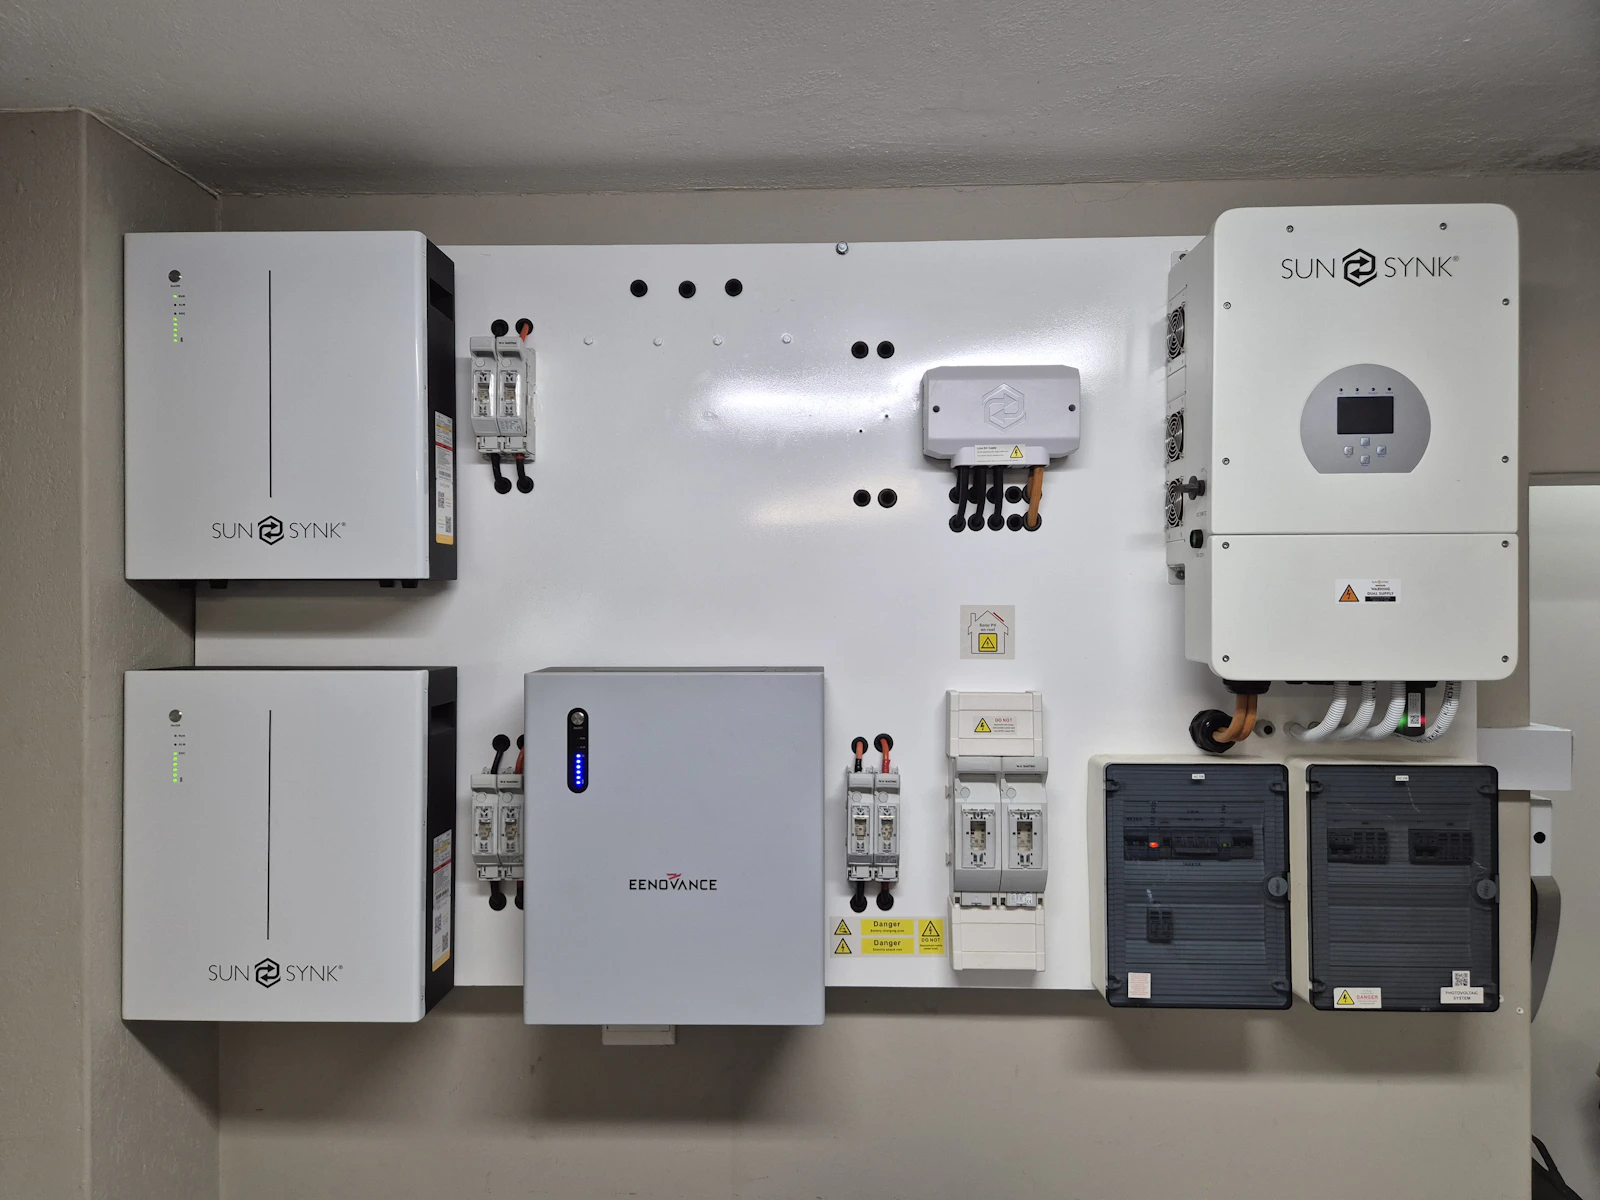

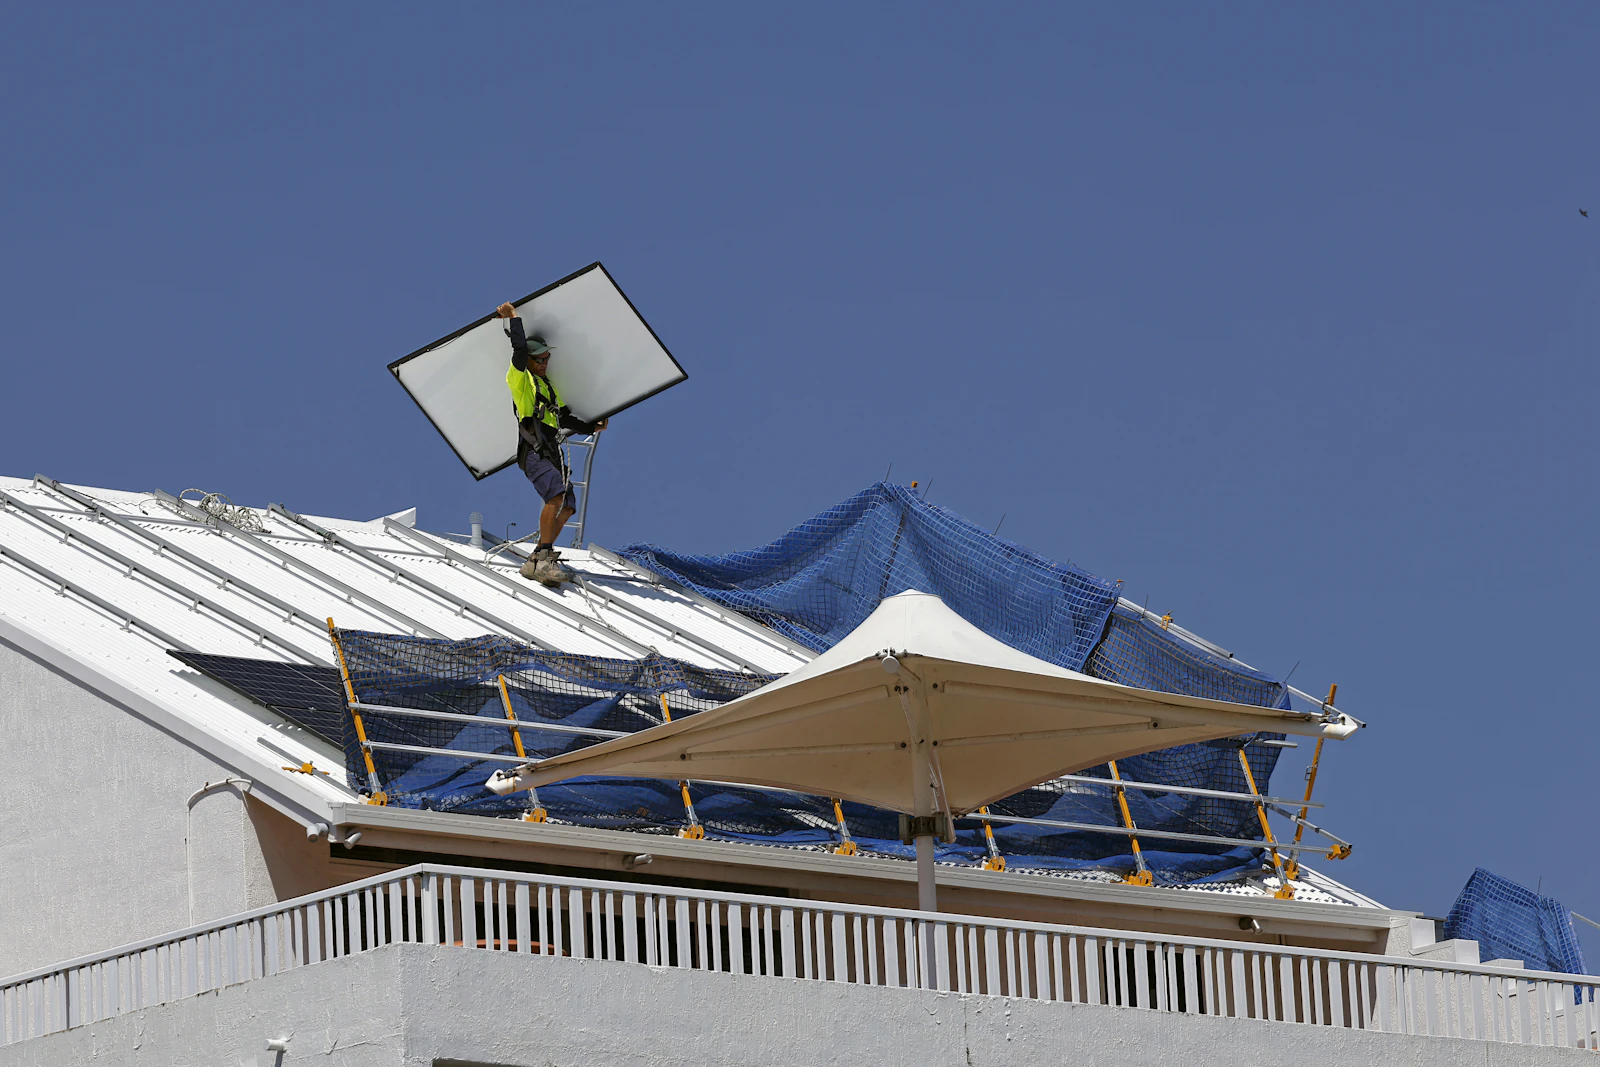
Every figure here carries its source and the date it was checked.
Each page opens by answering its own question in a couple of sentences, then shows the arithmetic underneath for anyone who wants to check it.
Solar pricing moves with the roof, the state, the utility and the financing. A single national figure fits almost nobody, so we publish the spread our sources support.
A shaded roof on a low tariff can be a poor buy. That is a legitimate answer to the question and you will find it here rather than a reason to keep reading.
We do not sell panels and we do not fit them, so nothing here depends on you signing. Licensed local companies do the work.
The questions homeowners actually ask before they sign anything.
No. P.L. 119-21, enacted 4 July 2025, ended the Residential Clean Energy Credit for expenditures made after 31 December 2025, and the IRS states that the credit is not available for property placed in service after that date. The 30% rate applied to installations from 2022 through 2025.
No. Under §25D(e)(8)(A) an expenditure is treated as made when the original installation is completed, so the IRS treats a 2026 completion as an expenditure made after 31 December 2025. The payment date is not the test, which is the part consumers most often get wrong.
In 2024 the median cash purchase came to $3.5 per watt and the median loan-financed system to $4.7 per watt. LBNL attributes the difference to dealer fees rolled into the up-front price the customer sees. The gap has widened from $0.6 per watt in 2017 to $1.2 per watt in 2024.
Because no source we hold publishes one. The national figures are per watt, and the dollar total depends on system size, which spanned roughly 4–11 kW for the middle 60% of 2024 installs. A per-watt figure multiplied by a stated system size is a number you can check; a headline total is not.
The system size in kilowatts-DC and the total price before financing, so you can divide one by the other and compare the result against the $4.0 per watt median for 2024 installs. A monthly payment answers neither question and hides both.
No. Solar Panel Answers connects you with licensed local solar companies. We are not a solar contractor, we do not sell or fit equipment, and we do not set the price you are quoted.